AbhiPrep

Radar/Spider Graphs

40 Questions

Practice Radar/Spider Graphs questions with answers and step-by-step solutions. These problems are curated from recent campus placement test papers (TCS, Infosys, Wipro, Cognizant, Accenture) and competitive government exams (SSC CGL, Bank PO, RRB NTPC, UPSC).

Radar/Spider Graphs: Reference Context & Data Shared for questions below
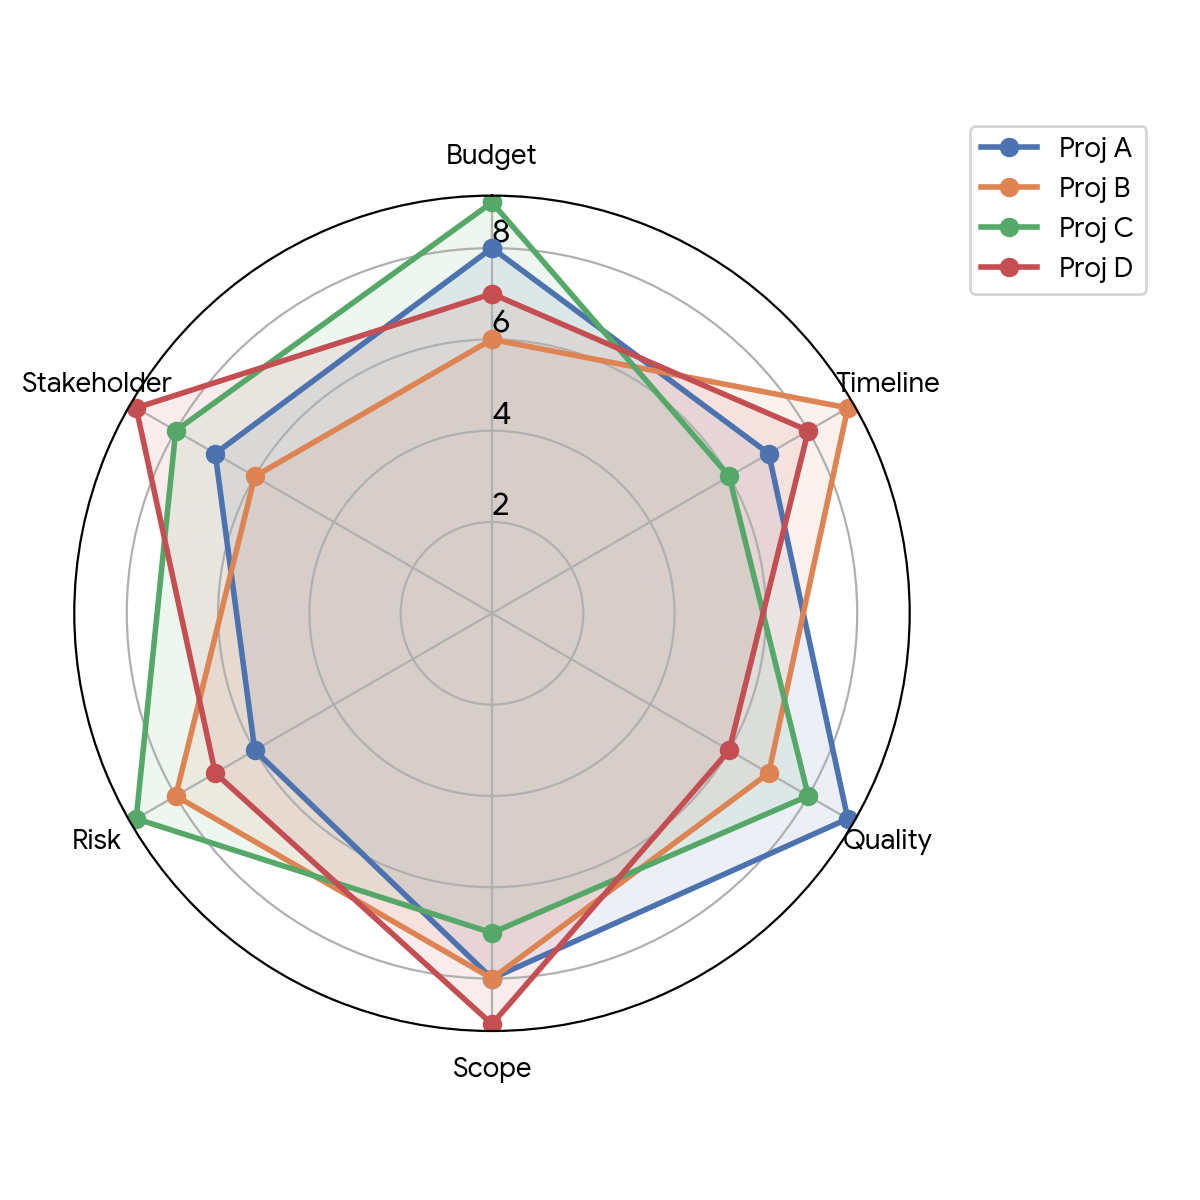
Caselet & Reference DataSet 8: Project Management Evaluation

Data Table (For precise calculation):

Question Chart / Diagram
Project
Budget
Timeline
Quality
Scope
Risk
Stakeholder
Proj A
8
7
9
8
6
7
Proj B
6
9
7
8
8
6
Proj C
9
6
8
7
9
8
Proj D
7
8
6
9
7
9
Q36

Which project scored the lowest on the Risk parameter?

medium
Q37

If all parameters are weighted equally, which project is performing the best overall?

medium
Q38

Project B's Timeline score is what percent more than Project C's Timeline score?

medium
Q39

What is the ratio of Project A's Quality score to Project D's Scope score?

medium
Q40

If Project C's Budget score was reduced by 1 and Stakeholder score increased by 2, what would be its new average score across all 6 parameters?

medium