AbhiPrep

Bar Graphs

40 Questions

Practice Bar Graphs questions with answers and step-by-step solutions. These problems are curated from recent campus placement test papers (TCS, Infosys, Wipro, Cognizant, Accenture) and competitive government exams (SSC CGL, Bank PO, RRB NTPC, UPSC).

Bar Graphs: Reference Chart & Data Shared for questions below
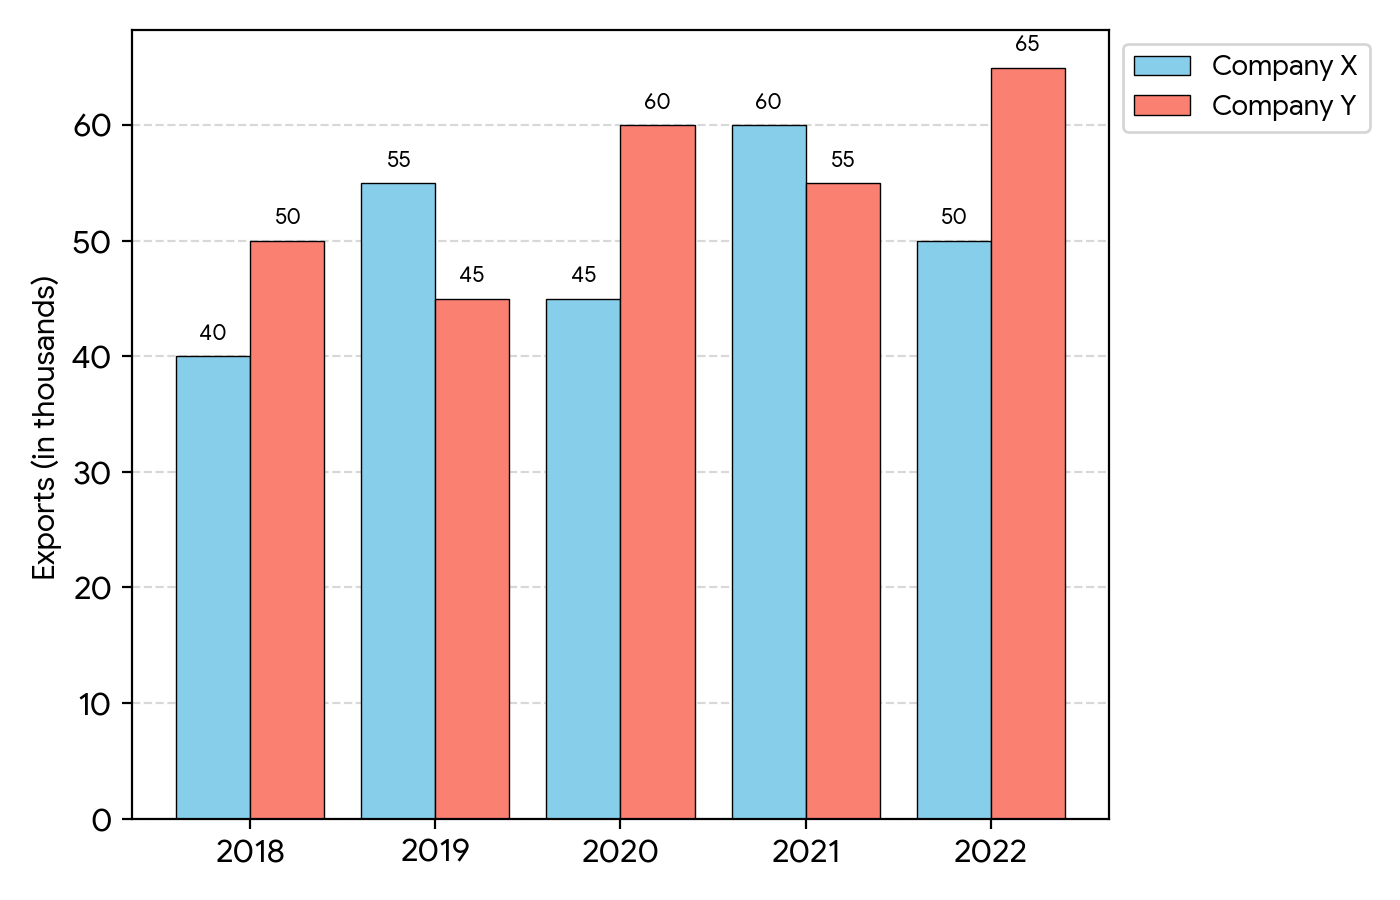
Bar Graph & DataSet 1: Export of Vehicles (in thousands) by Company X and Y

Data Interpretation: Bar Graphs with Images

Question Bar Graph & Data
Q1

What is the average export (in thousands) of Company X over the given period?

medium
Q2

What is the percentage increase in the exports of Company Y from 2019 to 2020?

medium
Q3

What is the ratio of the total exports of Company X in 2018 and 2019 to the total exports of Company Y in 2021 and 2022?

medium
Q4

In how many years was the export of Company X more than the average export of Company Y over the given period?

medium
Q5

The total exports of Company X is approximately what percent of the total exports of Company Y over the given 5 years?

medium