AbhiPrep

Radar/Spider Graphs

40 Questions

Practice Radar/Spider Graphs questions with answers and step-by-step solutions. These problems are curated from recent campus placement test papers (TCS, Infosys, Wipro, Cognizant, Accenture) and competitive government exams (SSC CGL, Bank PO, RRB NTPC, UPSC).

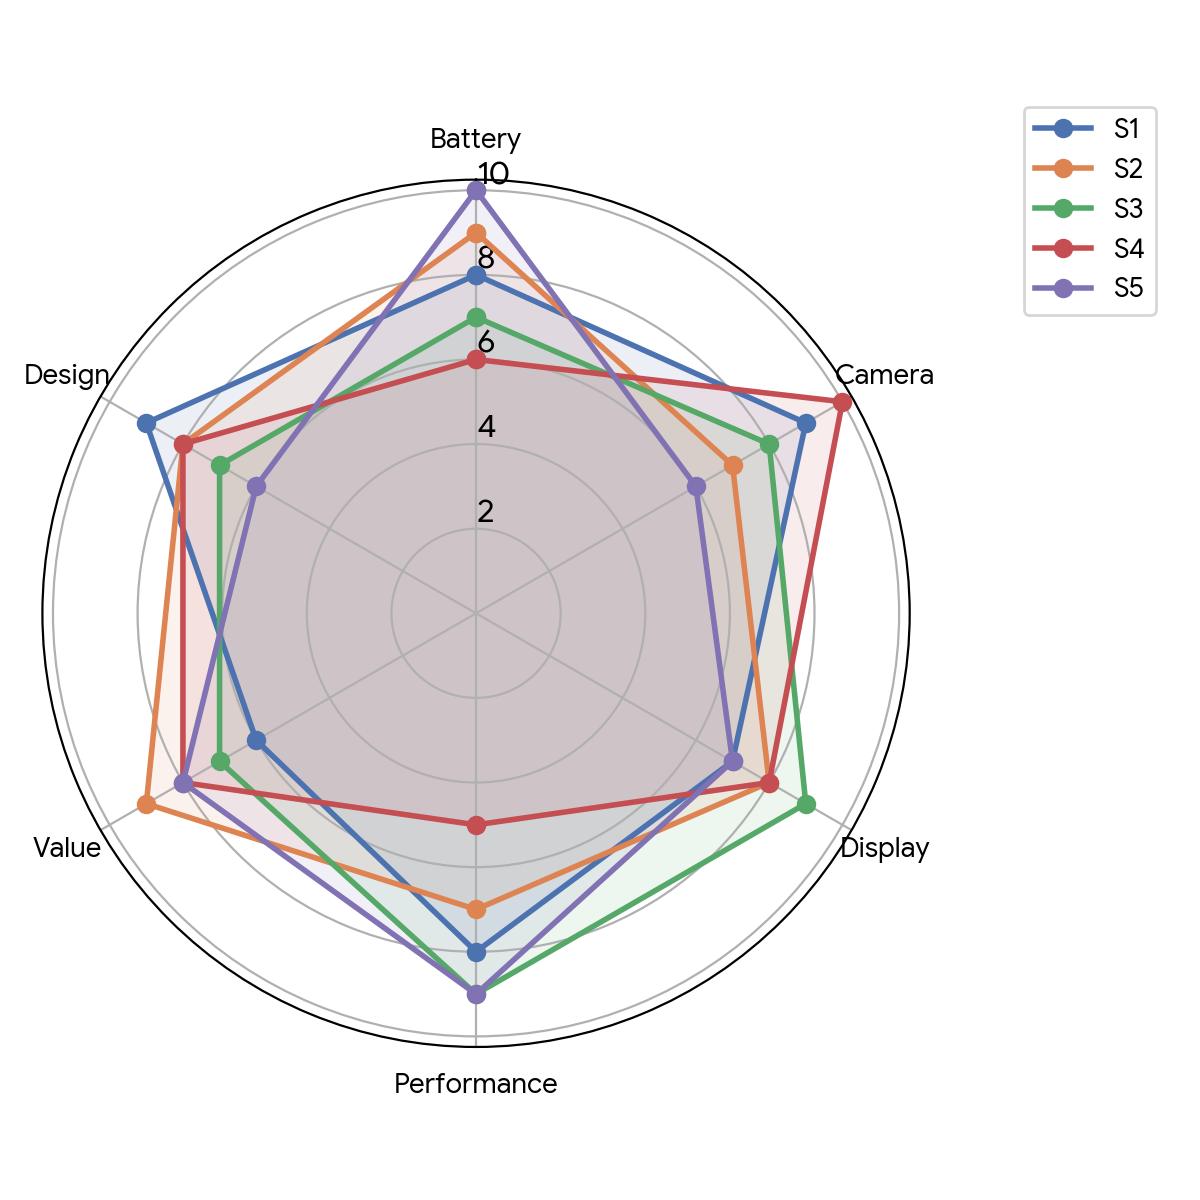
Radar/Spider Graphs: Reference Context & Data Shared for questions below
Caselet & Reference DataSet 3: Smartphone Assessment

Data Table (For precise calculation):

Question Chart / Diagram
Phone
Battery
Camera
Display
Performance
Value
Design
S1
8
9
7
8
6
9
S2
9
7
8
7
9
8
S3
7
8
9
9
7
7
S4
6
10
8
5
8
8
S5
10
6
7
9
8
6
Q11

Which smartphone has the highest total score?

medium
Q12

If a customer values Camera at 40%, Performance at 40%, and Battery at 20% (ignoring other metrics), which phone is the best?

medium
Q13

What is the average Display score of all 5 smartphones?

medium
Q14

Which phone has the maximum variation (difference between its highest and lowest parameter score)?

medium
Q15

Phone S3's Battery score is what percent less than Phone S5's Battery score?

medium