AbhiPrep

Radar/Spider Graphs

40 Questions

Practice Radar/Spider Graphs questions with answers and step-by-step solutions. These problems are curated from recent campus placement test papers (TCS, Infosys, Wipro, Cognizant, Accenture) and competitive government exams (SSC CGL, Bank PO, RRB NTPC, UPSC).

Radar/Spider Graphs: Reference Context & Data Shared for questions below
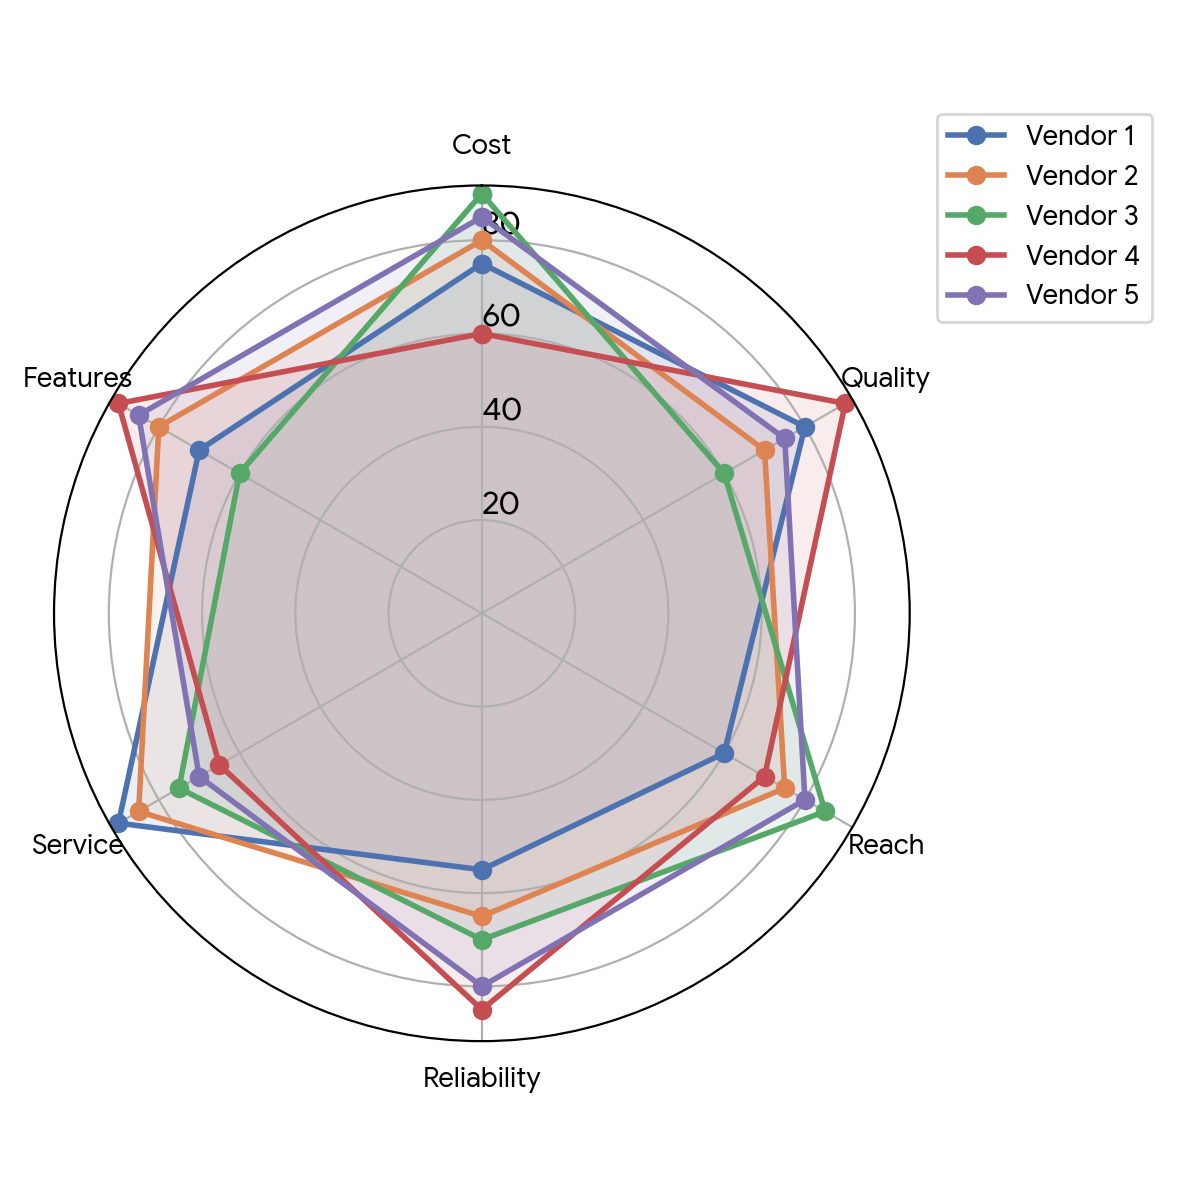
Caselet & Reference DataSet 1: Vendor Evaluation on Six Aspects

Data Interpretation: Radar/Spider Graphs (Medium to Hard)

Data Table (For precise calculation):

Question Chart / Diagram
Vendor
Cost
Quality
Reach
Reliability
Service
Features
Vendor 1
75
80
60
55
90
70
Vendor 2
80
70
75
65
85
80
Vendor 3
90
60
85
70
75
60
Vendor 4
60
90
70
85
65
90
Vendor 5
85
75
80
80
70
85
Q1

Which vendor is among the top two vendors in exactly three aspects?

medium
Q2

If a composite score is calculated as (0.3 * Quality + 0.2 * Reliability + 0.5 * Cost), which vendor has the highest composite score?

medium
Q3

What is the absolute difference between the average score of Vendor 5 and Vendor 1 across all six aspects?

medium
Q4

Which aspect has the lowest average score across all five vendors?

medium
Q5

If Vendor 2's Features score was improved by 25% and its Reach score dropped by 20%, what would be its new average score across all 6 aspects?

medium