AbhiPrep

Radar/Spider Graphs

40 Questions

Practice Radar/Spider Graphs questions with answers and step-by-step solutions. These problems are curated from recent campus placement test papers (TCS, Infosys, Wipro, Cognizant, Accenture) and competitive government exams (SSC CGL, Bank PO, RRB NTPC, UPSC).

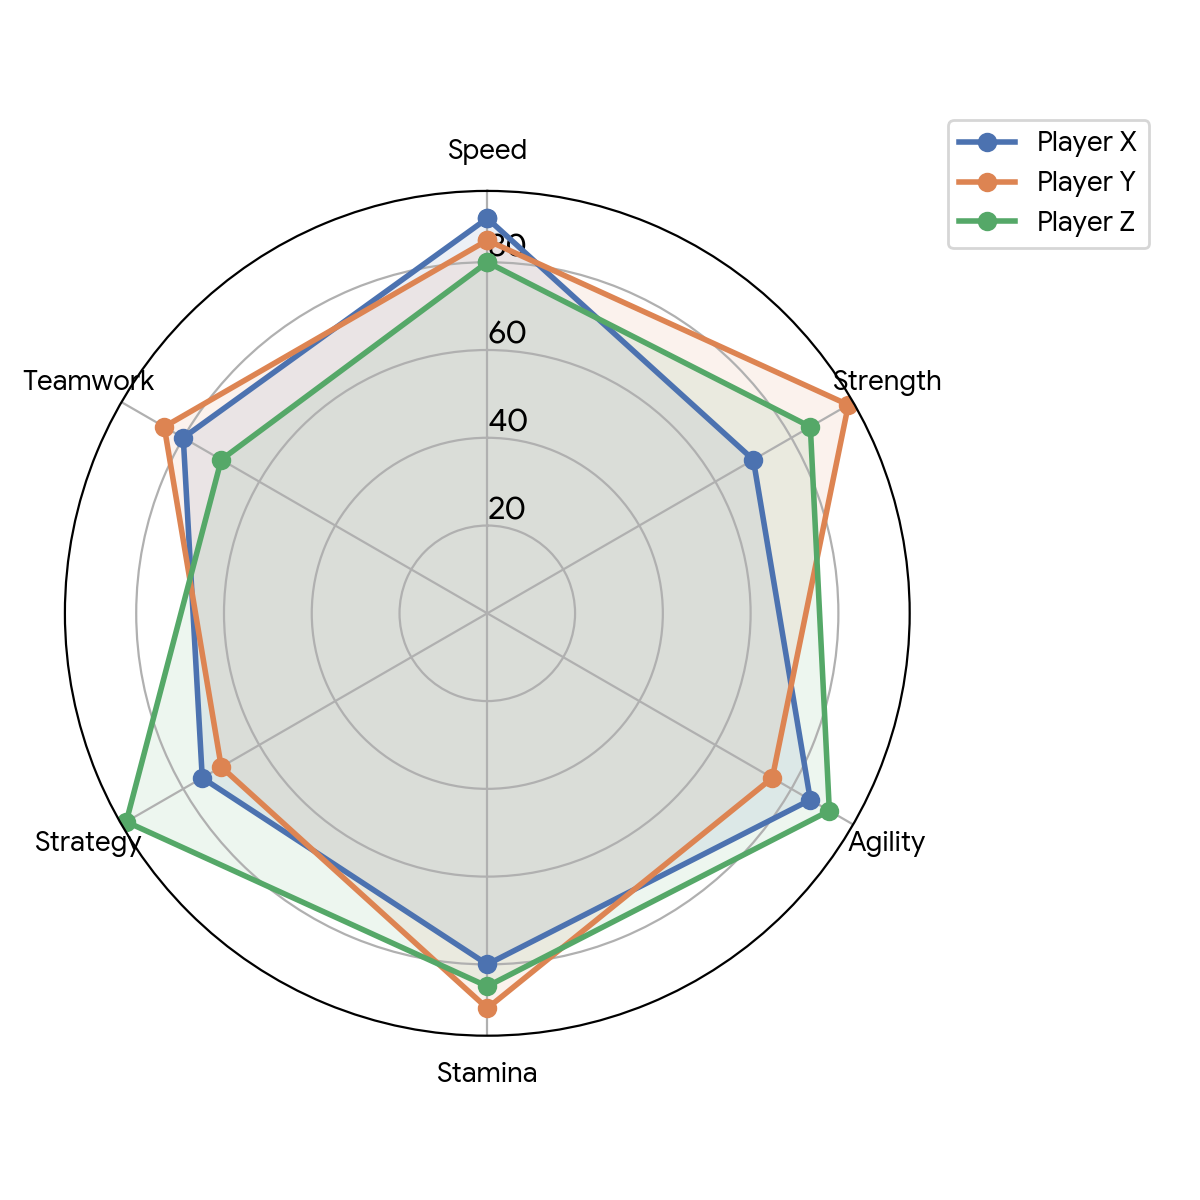
Radar/Spider Graphs: Reference Context & Data Shared for questions below
Caselet & Reference DataSet 4: Athlete Skill Profile

Data Table (For precise calculation):

Question Chart / Diagram
Athlete
Speed
Strength
Agility
Stamina
Strategy
Teamwork
Player X
90
70
85
80
75
80
Player Y
85
95
75
90
70
85
Player Z
80
85
90
85
95
70
Q16

Which athlete has the highest average score?

medium
Q17

If an obstacle course requires 50% Agility, 30% Speed, and 20% Stamina, who scores the highest?

medium
Q18

What is the absolute difference between Player Y's Strength score and Player Z's Teamwork score?

medium
Q19

Which skill parameter has the lowest total score among the three athletes?

medium
Q20

Player X's Strategy score is approximately what percent of Player Z's Strategy score?

medium