AbhiPrep

Pie Charts

40 Questions

Practice Pie Charts questions with answers and step-by-step solutions. These problems are curated from recent campus placement test papers (TCS, Infosys, Wipro, Cognizant, Accenture) and competitive government exams (SSC CGL, Bank PO, RRB NTPC, UPSC).

Pie Charts: Reference Chart & Data Shared for questions below
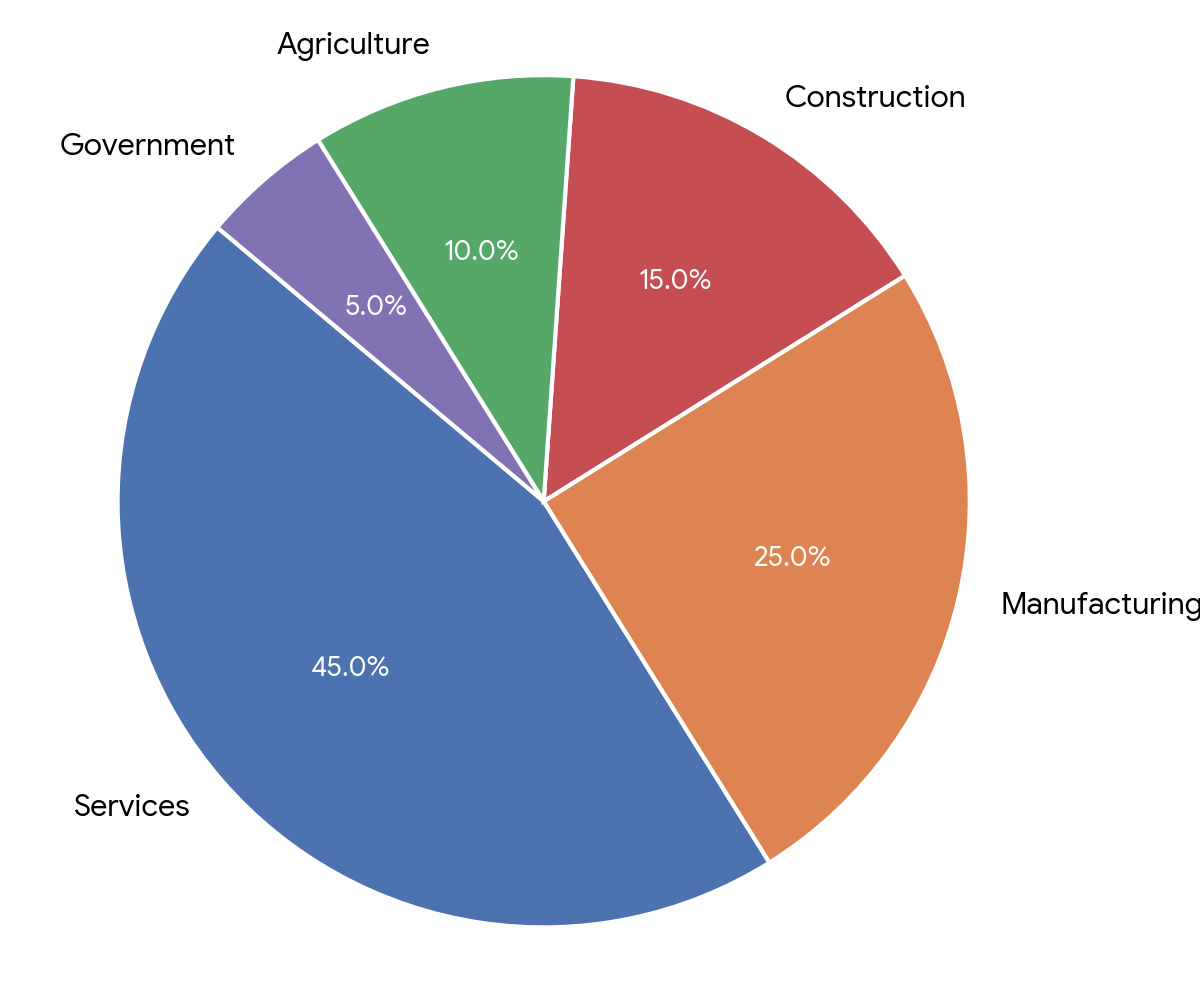
Pie Chart & DataSet 6: Workforce Distribution in a Metropolitan City (Total = 4.5 Million)
Question Pie Chart & Data
Q26

How many more people are employed in Services compared to Construction?

medium
Q27

What is the central angle representing the Manufacturing workforce?

medium
Q28

What is the ratio of the combined workforce in Services and Government to the combined workforce in Manufacturing and Construction?

medium
Q29

If 20% of the agricultural workforce migrates to the Construction sector, what will be the new total workforce in Construction?

medium
Q30

What is the average number of workers in the top 3 employment sectors?

medium