AbhiPrep

Pie Charts

40 Questions

Practice Pie Charts questions with answers and step-by-step solutions. These problems are curated from recent campus placement test papers (TCS, Infosys, Wipro, Cognizant, Accenture) and competitive government exams (SSC CGL, Bank PO, RRB NTPC, UPSC).

Pie Charts: Reference Chart & Data Shared for questions below
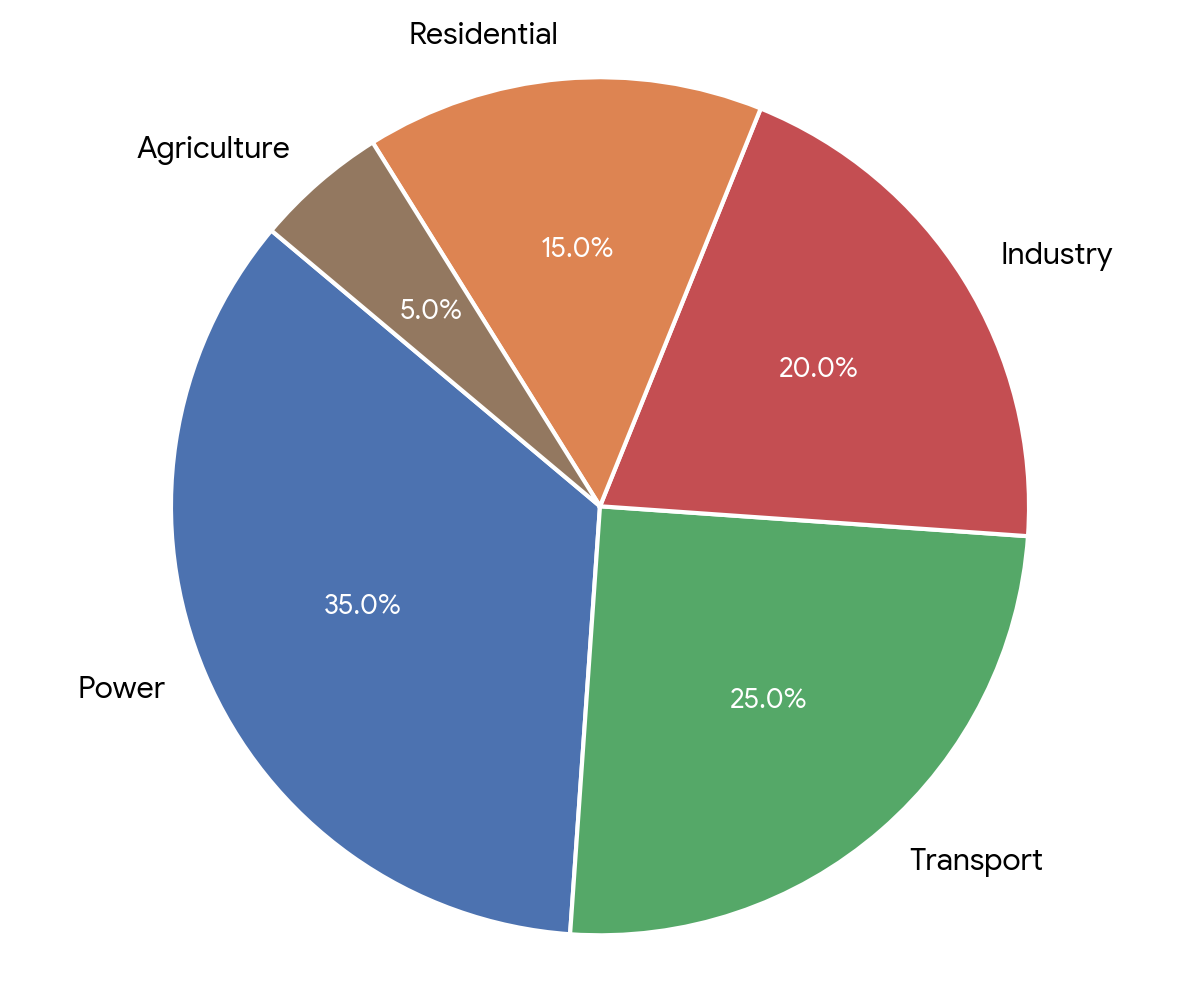
Pie Chart & DataSet 3: National CO2 Emissions by Sector (Total = 40,000 Million Tonnes)
Question Pie Chart & Data
Q11

What is the average CO2 emission (in Million Tonnes) of the Transport, Industry, and Residential sectors combined?

medium
Q12

If the Power sector's emissions are reduced by 10% (relative to its own current value) next year, and all other sectors remain constant, what will be the new total national emission?

medium
Q13

What is the ratio of the difference in emissions between Power and Industry to the combined emissions of Transport and Agriculture?

medium
Q14

What is the central angle of the sector representing Agriculture?

medium
Q15

If Industry emissions were to increase by 20% of their current value due to economic expansion, what would be the new absolute emission of the Industry sector?

medium