AbhiPrep

Line Graphs

40 Questions

Practice Line Graphs questions with answers and step-by-step solutions. These problems are curated from recent campus placement test papers (TCS, Infosys, Wipro, Cognizant, Accenture) and competitive government exams (SSC CGL, Bank PO, RRB NTPC, UPSC).

Line Graphs: Reference Graph & Data Shared for questions below
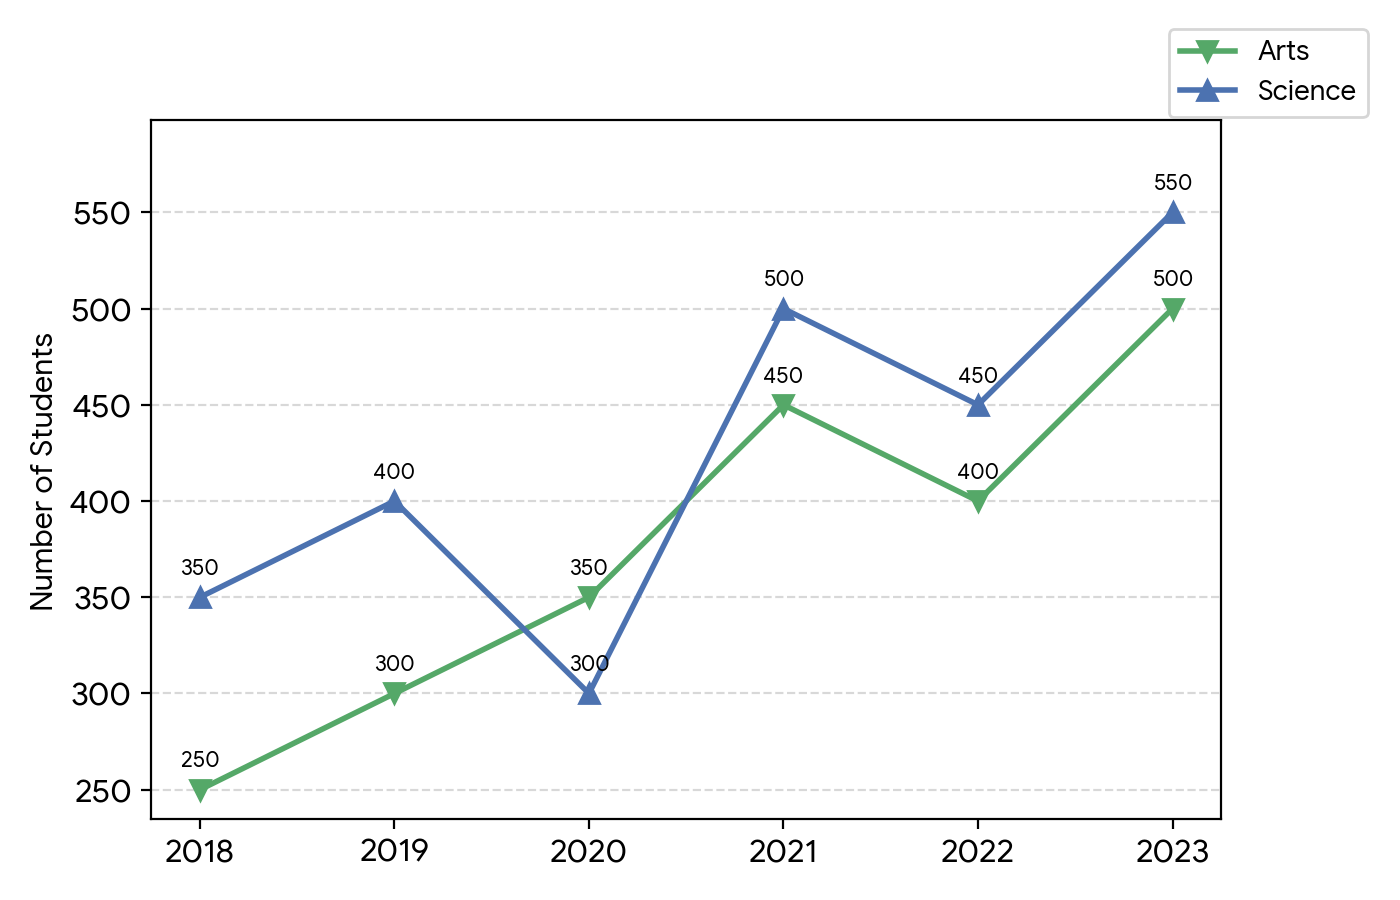
Line Graph & DataSet 5: Students Enrolled in Arts and Science (in numbers)
Question Line Graph & Data
Q21

What is the ratio of total Arts students to total Science students over the six years?

medium
Q22

The number of Arts students in 2021 is exactly what percent of the Science students in the same year?

medium
Q23

What is the average number of students enrolled in Science across all years?

medium
Q24

In which year was the total number of enrolled students (Arts + Science) the highest?

medium
Q25

What is the percentage increase in the total number of students (Arts + Science) from 2018 to 2019?

medium