AbhiPrep

Bar Graphs

40 Questions

Practice Bar Graphs questions with answers and step-by-step solutions. These problems are curated from recent campus placement test papers (TCS, Infosys, Wipro, Cognizant, Accenture) and competitive government exams (SSC CGL, Bank PO, RRB NTPC, UPSC).

Bar Graphs: Reference Chart & Data Shared for questions below
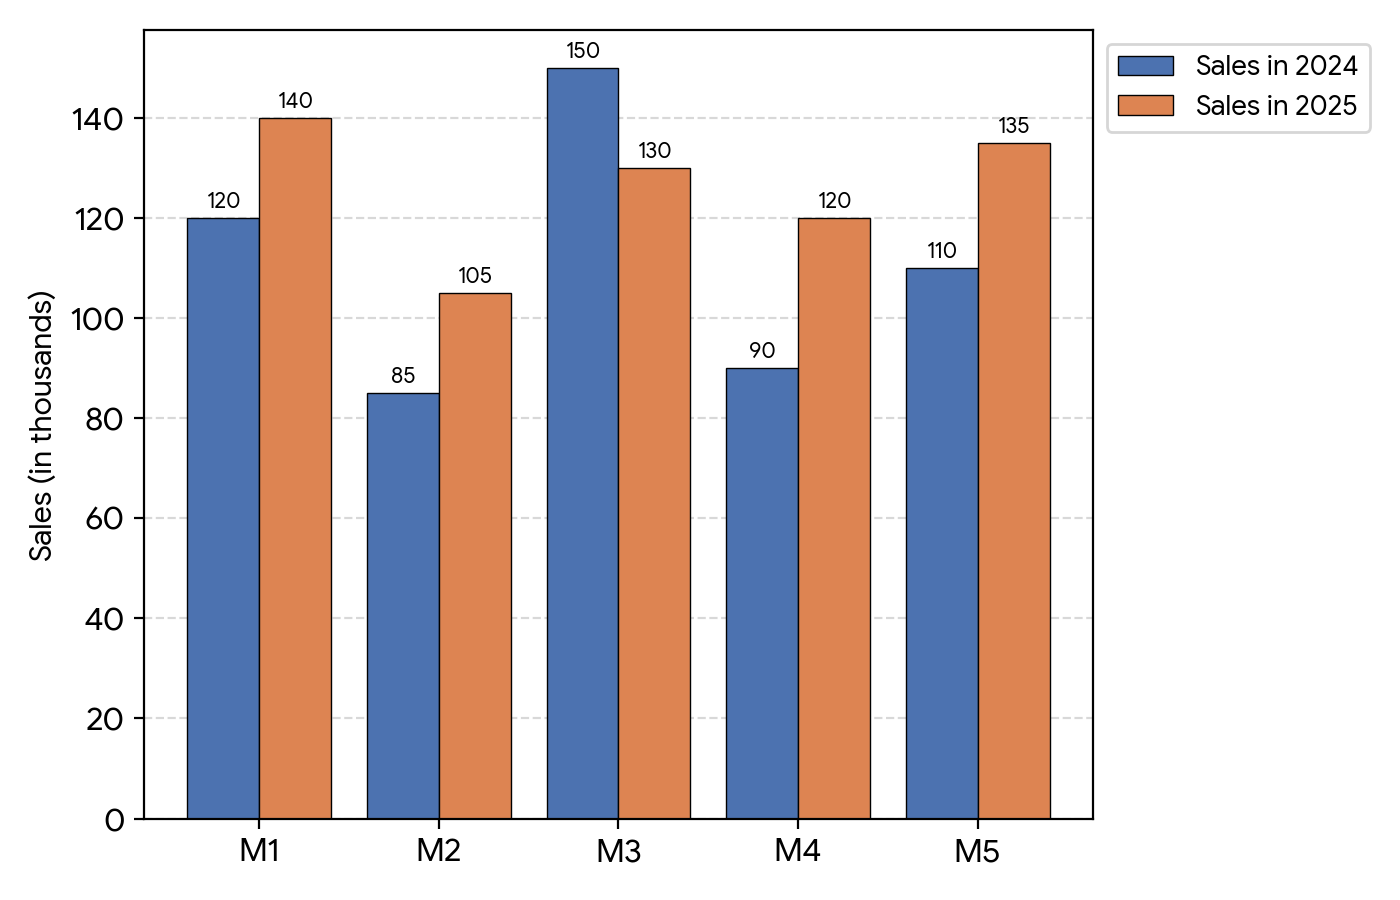
Bar Graph & DataSet 2: Smartphone Sales (in thousands) in 2024 and 2025
Question Bar Graph & Data
Q6

What is the difference between the average sales of smartphones in 2024 and the average sales in 2025?

medium
Q7

The sales of model M3 in 2024 is what percent more than the sales of model M4 in 2025?

medium
Q8

What is the ratio of the total sales of models M1 and M2 in 2024 to the total sales of models M4 and M5 in 2025?

medium
Q9

Which smartphone model showed the maximum percentage increase in sales from 2024 to 2025?

medium
Q10

If the sales of model M5 are projected to grow by 20% in 2026 over its 2025 sales, what will be the sales of M5 (in thousands) in 2026?

medium