Exam Strategies
1 min read
761 Views
Complete Guide to Data Interpretation (DI) for SSC CGL & Competitive Exams
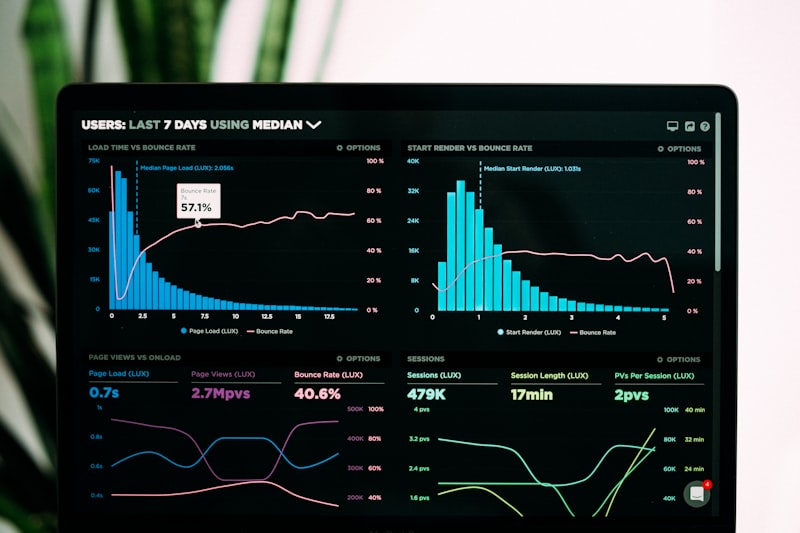
Learn how to analyze complex tabular charts, multi-variable bar graphs, and degree-to-percentage pie charts for high accuracy in SSC CGL Tier 1 and Tier 2.
Table of Contents
2 Key SectionsUnderstanding the Core Structure of Data Interpretation#
Data Interpretation tests your ability to extract mathematical relationships from structured tables, graphs, and charts. It combines Averages, Percentages, and Ratios into real-world business and economic datasets.
1. Degree to Percentage Conversion in Pie Charts#
Remember that a complete circle is 360 degrees, which represents 100%. To convert degrees into percentage:
Percentage (%) = (Given Degrees / 360) * 100
Conversely, to convert percentage into degrees: Degrees = (Percentage / 100) * 360.
A
About The Author
AbhiPrep Editorial Team
Dedicated to providing high-yield aptitude tricks, reasoning shortcuts, and comprehensive recruitment exam strategies to help aspirants excel in competitive tests.